bau-mussel-dynamics
![]()
![]()
Table of contents
- Introduction
- Citation
- Study site
- Data description
- Monthly population variation of freshwater pearl mussel
- Strong correlation between population and depth of pond
- R notebook
Introduction
Freshwater pearl mussel Lamellidens marginalis is a commercially important aquatic species in Bangladesh. But little research has been done about the seasonality of its yield. We conducted a year-long study at a culture pond in Bangladesh to understand the temporal variation of mussel population. We used quadrat sampling method to estimate the natural population of L. marginalis in the lentic habitat. Thereby, we tried to establish the months of minimum and maximum mussel yields. Simultaneously, we recorded a few water quality parameters to assess their impacts on mussel growth.
Our collected data of mussel samples, their biometric measurements, and concomitant water quality parameters are released via this GitHub repository. Moreover, we made all our R codes available here to facilitate future fisheries management research.
Webpage: https://ff-usa.github.io/bau-mussel-dynamics/
Citation
If you use this data, please cite as below:
Fouzia Fariha, Tashrif Billah, Bishjiet Chandro, Md. Masud Rana, Md. Jasim Uddin, Freshwater pearl mussel population dynamics data by Bangladesh Agricultural University, 2024, DOI: 10.5281/zenodo.14996734
Study site
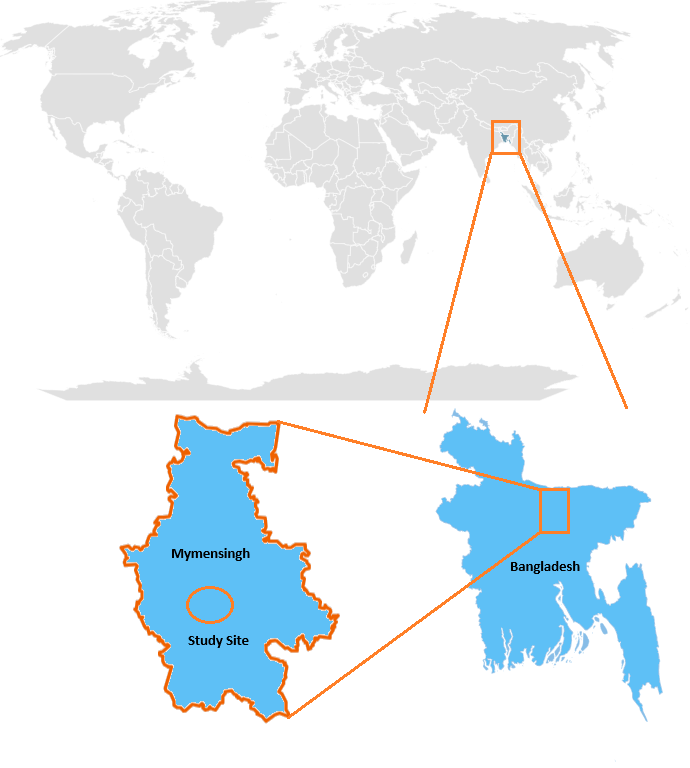
Study site in Mymensingh, Bangladesh. Map was generated using Microsoft Excel, Microsoft Paint, and OpenStreetMap (https://www.openstreetmap.org/copyright)
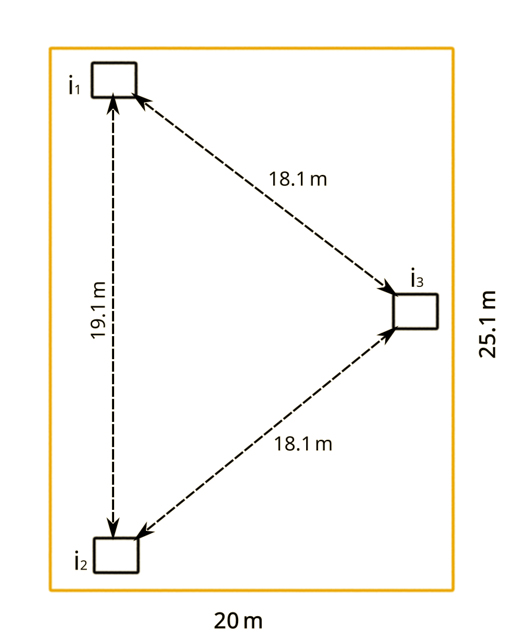
Culture pond and quadrats
Data description
Collected data have been made available in three files:
- population.csv
- water-quality.csv
- shell-biometrics.csv
Each file spans over April 2023-March 2024, the sampling period.
There is a Month column in each file. Other columns and their
units are noted below:
| File | Columns | Unit | Description |
|---|---|---|---|
| population.csv | i1, i2, i3 | Number of mussels sampled in quadrats i1, i2, i3 | |
| water-quality.csv | Depth | meter | Average depth of three quadrats |
| water-quality.csv | Temperature | °C | Temperature of pond water |
| water-quality.csv | pH | pH of pond water | |
| biometrics.csv | Length, width, height | millimeter | Average dimensions of sampled mussels |
Monthly population variation of freshwater pearl mussel
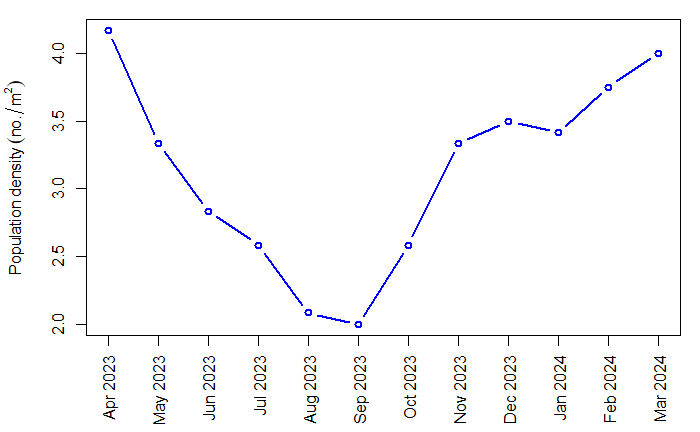
Population density is minimum in September and maximum in April.
Strong correlation between population and depth of pond
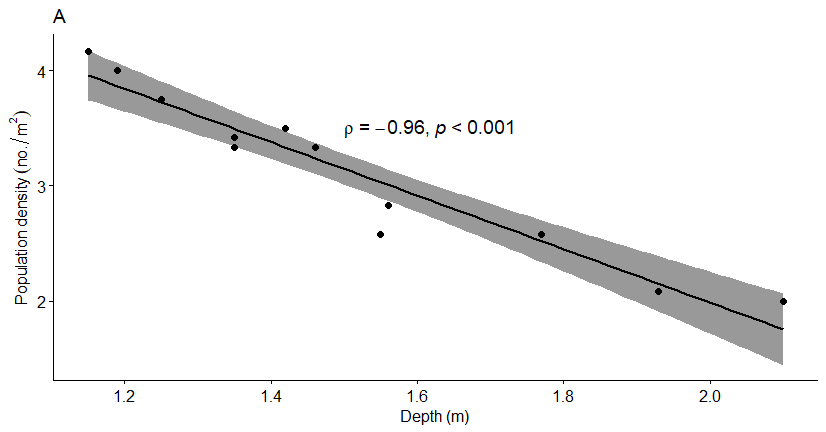
p<0.001 indicates significant correlation.
R notebook
Detailed data analysis can be found in the following notebook:
https://ff-usa.github.io/bau-mussel-dynamics/mussel.html